Using the new algorithm ASMODEE (Automatic Selection of Models and Outlier Detection for Epidemics) we monitor changes in potential COVID-19 cases reported through the NHS pathways, including calls to 111, 999, and 111-online. These analyses are broken down by Clinical Commissioning Groups (CCG). Only the last 6 weeks of data are used. The last week of data is not used to define the temporal trend so that recent outliers can be detected.
Note: this research has not been peer-reviewed yet. This website is still experimental. Please contact the authors before using its content.
- Gaussian GLM and Negative Binomial GLMs
- With the following effects
- constant, linear, or log-linear time effect
- optional: weekend effect (weekend / monday / other day, or weekday effect )
- optional: with a change in slope at a given day, from day 9 to day 25
Analyses are run separately for each CCG.
Results: 111/999 calls and 111-online.
These analyses use calls to 111 and 999, as well as NHS 111-online reports of potential COVID-19 cases.
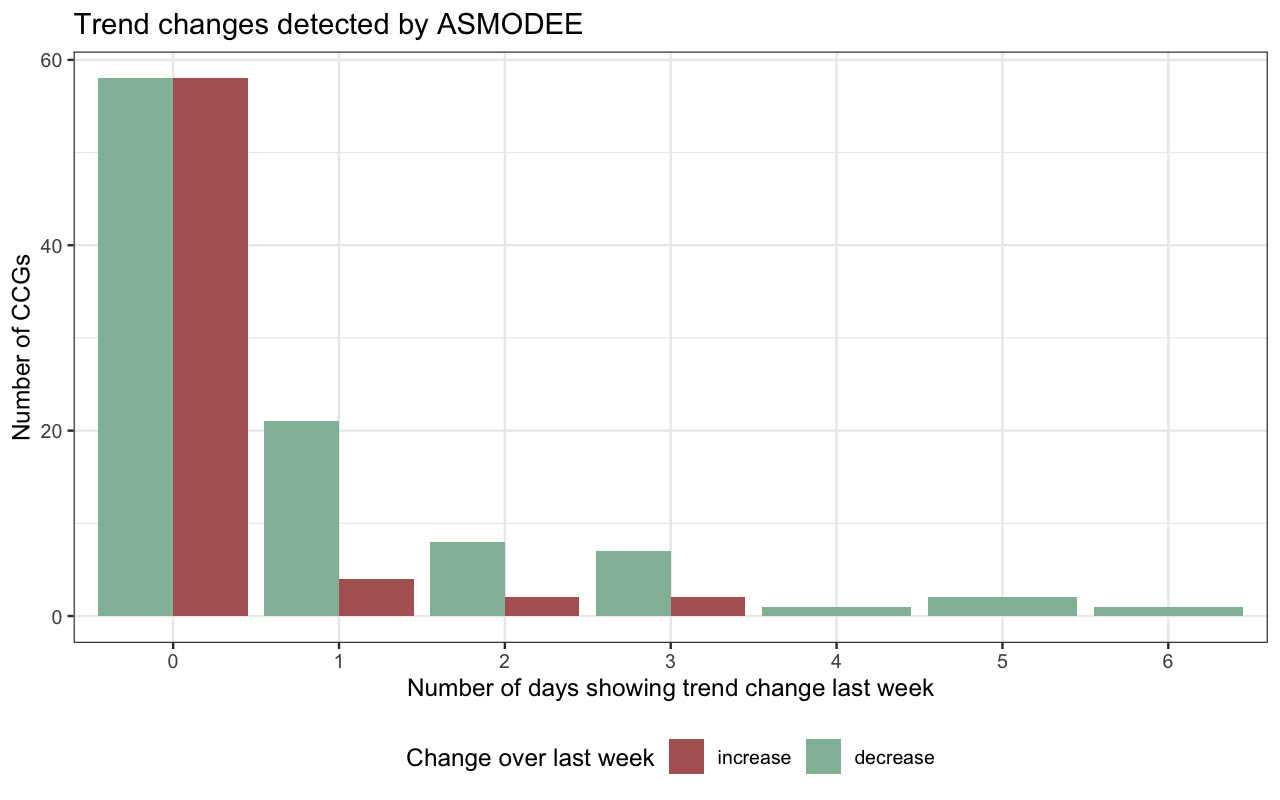
Trend changes over the last week: overview
This graph provides an overview of the numbers of increases/decreases detected at a CCG level by ASMODEE over the last week.
CCGs with number of ASMODEE outlier days and growth rate
Selecting the outlier radial will display the number of days each CCG is outlying the ASMODEE predictions for, the growth rate radial displays the CCG growth rate. Selecting the CCG of interest will present the ASMODEE plot for that CCG
The growth rate (r) can be roughly interepreted as the percentage of daily increase / decrease in case incidence. For instance, a r of 0.015 means incidence increases by 1.5% every day, while a value of -0.02 means incidence decreases by approximately 2% every day. See this excellent article for more information on r and its relationship with the reproduction number, R.
CCG by numbers of outliers
The following graph shows ASMODEE results ordered by decreasing amounts of outliers in the last 7 days.
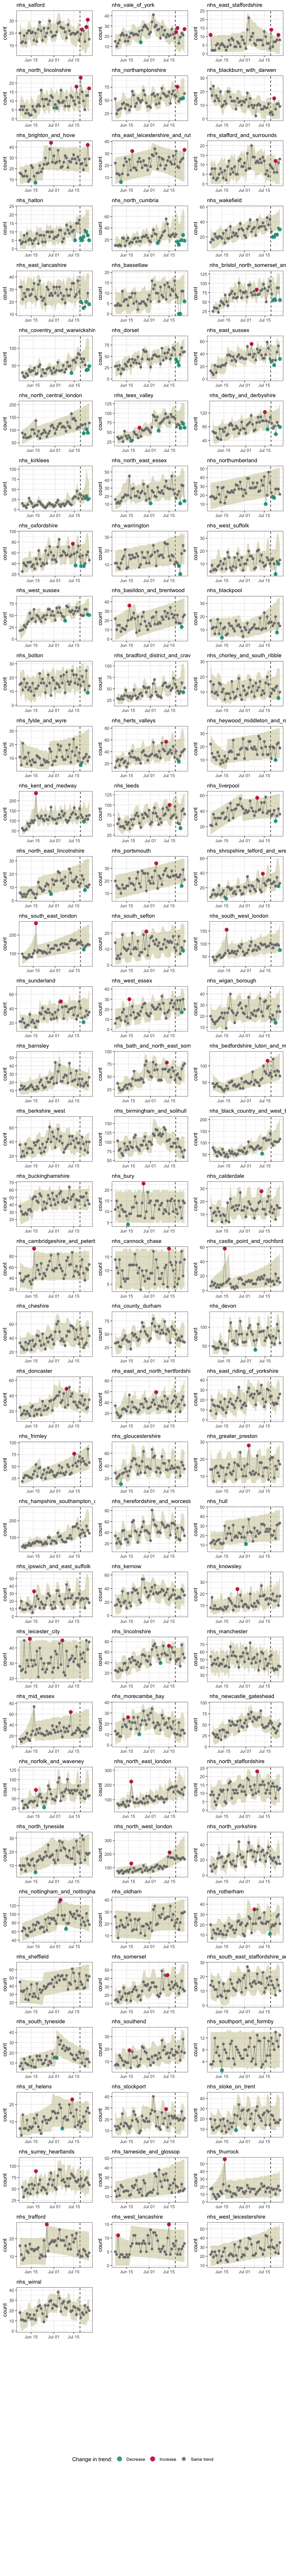
Table summary for all CCGs
This table summarises the numbers of changes detected by ASMODEE over the last 7 days, broken down into increases and decreases. prob is the probability of observing that many outliers in the last week under the best fitting model, given the chosen alpha threshold (5%).