Methodology
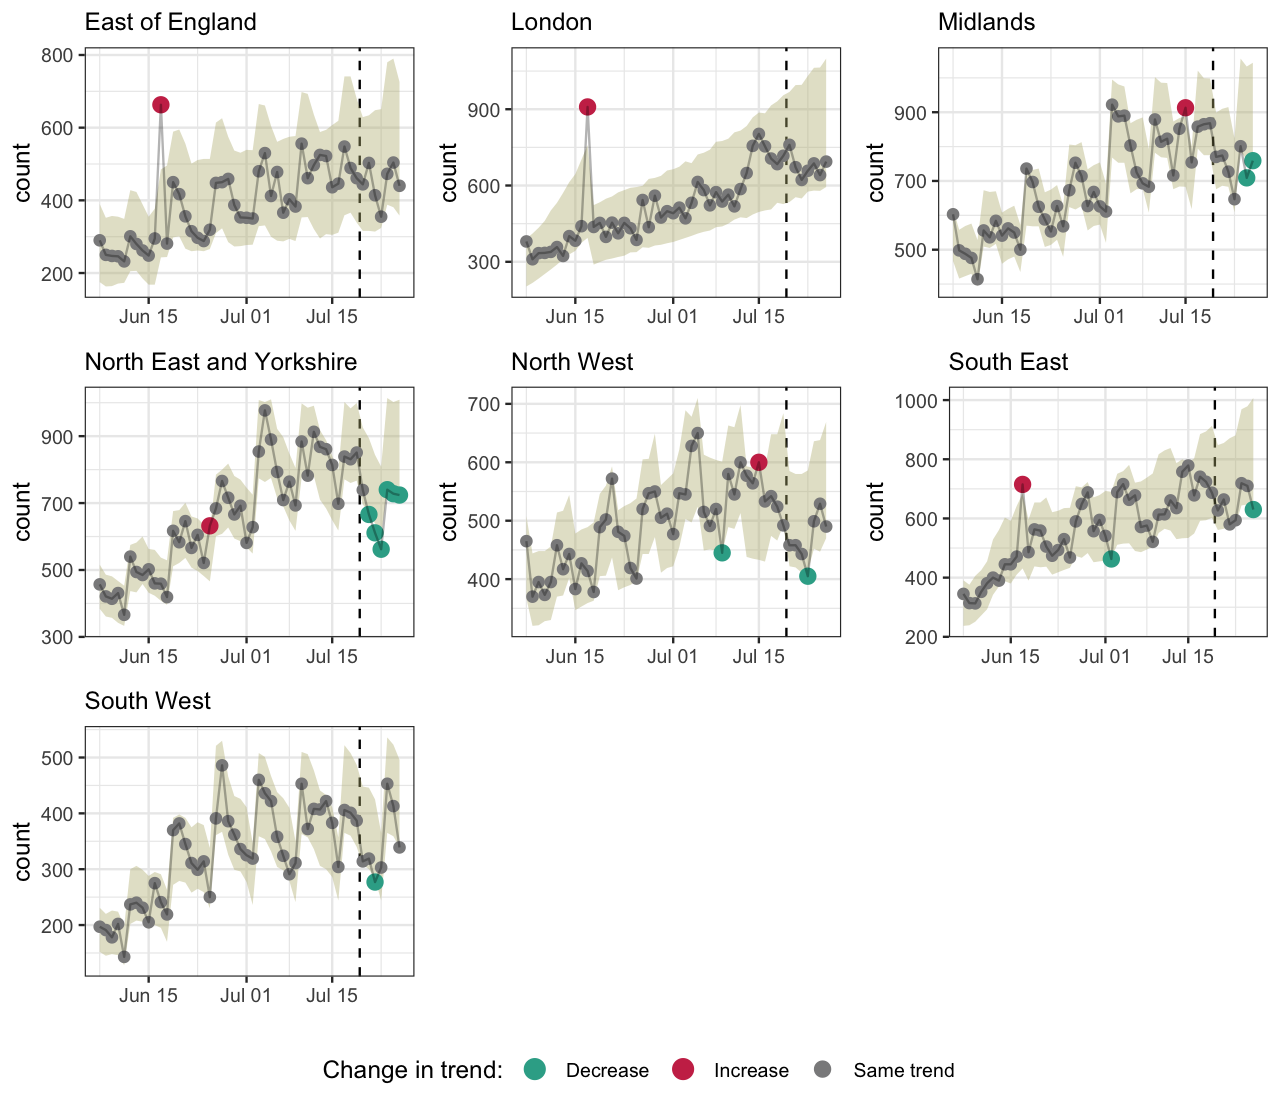
Using the new algorithm ASMODEE (Automatic Selection of Models and Outlier Detection for Epidemics) we monitor changes in potential COVID-19 cases reported through the NHS pathways, including calls to 111, 999, and 111-online. Only the last 6 weeks of data are used.
Note: this research has not been peer-reviewed yet. This website is still experimental. Please contact the authors before using its content.
Models considered here for trend fitting include:
- Gaussian (left-censored) GLM and Negative Binomial GLM
- With the following effects
- constant, linear, or log-linear time effect
- optional: weekend effect (weekend / monday / other day, or weekday effect )
- optional: with a change in slope at a given day, from day 9 to day 25
Analyses are run separately for each NHS region.
ASMODEE results
England

NHS regions

Analyses by age groups
This section reproduces the same analyses as above, broken down by age groups.
All of England

NHS regions

Estimates of growth rates
These estimates of daily growth rates are based on negative binomial GLM fitted to the last 3 weeks of data. Positive values indicate epidemic growth, and negative values indicate decline. Confidence intervals including zero indicate uncertain trends.
The growth rate (r) can be roughly interepreted as the percentage of daily increase / decrease in case incidence. For instance, a r of 0.015 means incidence increases by 1.5% every day, while a value of -0.02 means incidence decreases by approximately 2% every day. See this excellent article for more information on r and its relationship with the reproduction number, R.
